Key Performance Indicators
Identifying & Utilizing KPI to Grow Your Business
Imagine driving a car without a dashboard showing engine temperature, gas gauges, and speed. Or worse, picture the pilot of a commercial flight flying blind without an entire dashboard of gauges to provide direction to the destination. Yet many business owners manage day-to-day operations of the company without Key Performance Indicators to drive the business to the desired target.
Once monthly financial statements are established and utilized as management tools, the focus shifts to identifying and utilizing Key Performance Indicators (KPI) to grow your business. KPI are performance metrics that allow clarity into the level of success according to your key business targets. They should be specific, actionable, and measurable items that allow the business to move forward incrementally. A KPI allows management to know in a moment how the business is operating relative to long-term business goals.
The use of KPI causes clarity for each person regarding his or her priorities and performance relative to participation in the larger picture. Depending on the level of specificity of the KPI, management can in real-time see the level of performance of employees by these measurements. For example, technology allows a call center to track the number of calls per employee or a manufacturing company to know the number of units produced per employee per hour. Management can adjust operations such as training, incentives, or coaching as needed in order to reach the overall goal of satisfied customers and profitability. Staff should also receive regular communication on the progress the company is achieving relative to its KPI.
KPIs also allow management to spot negative trends and take action before they are detrimental to the business. A close eye on AR days outstanding allows cash flow to remain steady to the entity and pressure to be applied to collections as this number grows.Similarly, a physician practice may track the average revenue received per patient visit. A decrease in this amount may flag the need for a coding review for accuracy and consistency.
KPI by Industry or Function
There are some universal KPI categories for every business. These should be refined for the company and its industry. The broader categories include revenue, marketing, inventory or backlog, timeliness of delivery, profitability, AR days outstanding, and AP days outstanding.
It is often helpful for the company to begin by selecting three to five KPI. These are then crafted into more specific KPI by department, function, or individual. For example, a professional service firm with three partners may desire to increase revenue 20% for the year to $1M in revenue. As a result, each partner would have the KPI of billings of $28,000 per month, or $7,000 per week. This simple metric allows clarity and clear performance measures.
The key to KPI choice and measurement is to understand the company’s business model, i.e. those factors that drive profitability. The challenge is to develop these KPI as it may take a bit of analysis and thinking. Some KPI you may wish to consider:
- Revenue trends, preferably monthly against the budget. In some businesses, this can be daily, but information systems are required. Multiple components of revenue may be important to track, especially when there are profitability differences.
- Gross margin and net income trends. These need to be both in dollars and in percentages. Ideally shown monthly against the budget.
- AR trends are often set as days sales outstanding in dollar amounts and aging.
- Working capital (current assets less current liabilities) gives some clarity on the liquidity of the company.
- AP trends in dollar amounts and aging.
Division level KPI could be:
- Productivity, usually against the budget.
- Customer satisfaction.
- Revenue trends, gross margin, and net income, usually against budgets.
Once the KPI is chosen, information systems may need to be adjusted to efficiently gather the data. QuickBooks has a lot of data that can be accessed. For most companies, there will be one or two KPI that go beyond the financial information. For example, quality control in a manufacturing facility can require separate data. Professional time charges to clients against standard available hours often referred to as utilization or productivity, need systems. Simple systems, such as charts and graphs in Microsoft Excel, are recommended rather than elaborate new software-based systems. Not only are the costs less but they are often utilized more consistently if kept simple.
Dashboards: KPI at a Glance
Dashboards take KPI and show them on a real-time basis, often as a visual pictorial. Charts and graphs are often easier to digest and show trends at a glance that might otherwise be overlooked with only numbers in the management process.
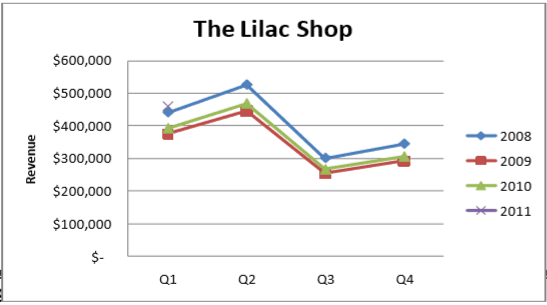
As a basic starting point, we suggest the creation of a line graph that shows three years of revenue trends on a quarterly basis such as the chart below for The Lilac Shop. This allows management to keep a close eye on income seasonality. Similar charts can be created for net income and cash flow.
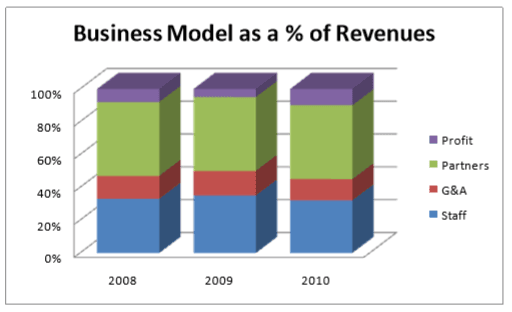
Another suggested KPI to track is the business model as a percentage of revenues. Below is a sample for Bill’s Consulting Group, LLC on an annual basis.
For a small business utilizing QuickBooks, the software has a “Company Snapshot” that provides charts and a graph dashboard for key data such as Income and Expense Trends, Top Customers By Sales, and AR by Aging Period. There are many web-based options which can be added to this, and some link directly to QuickBooks. Dashboardtosuccess.com, for example, allows small business owners to create a dashboard with online access for $9.99 per month. Larger companies may invest in dashboard software that links directly to their financial software for easy migration of data.
Dependent on the KPI, it may be measured on a daily, weekly or monthly basis. However, timeframes longer than this tend to cause them to not stay top of mind but may be useful in the annual review process.
Action Items
1. Select 3-5 KPI for your business and begin monitoring them on a consistent basis.
Articles for Further Reading
1. This article provides focuses on step-by-step instructions for identifying KPI as relates to online activity. http://www.practicalecommerce.com/articles/381-Identify-your-KPIs
2. This site provides an overview of KPI as well as numerous dashboards that are available for companies to utilize. http://www.dashboardzone.com/kpi-purpose-and-benefits
3. This site introduces and explains the use of dashboards in enhancing your business. http://technology.inc.com/software/articles/200704/dashboard.html
